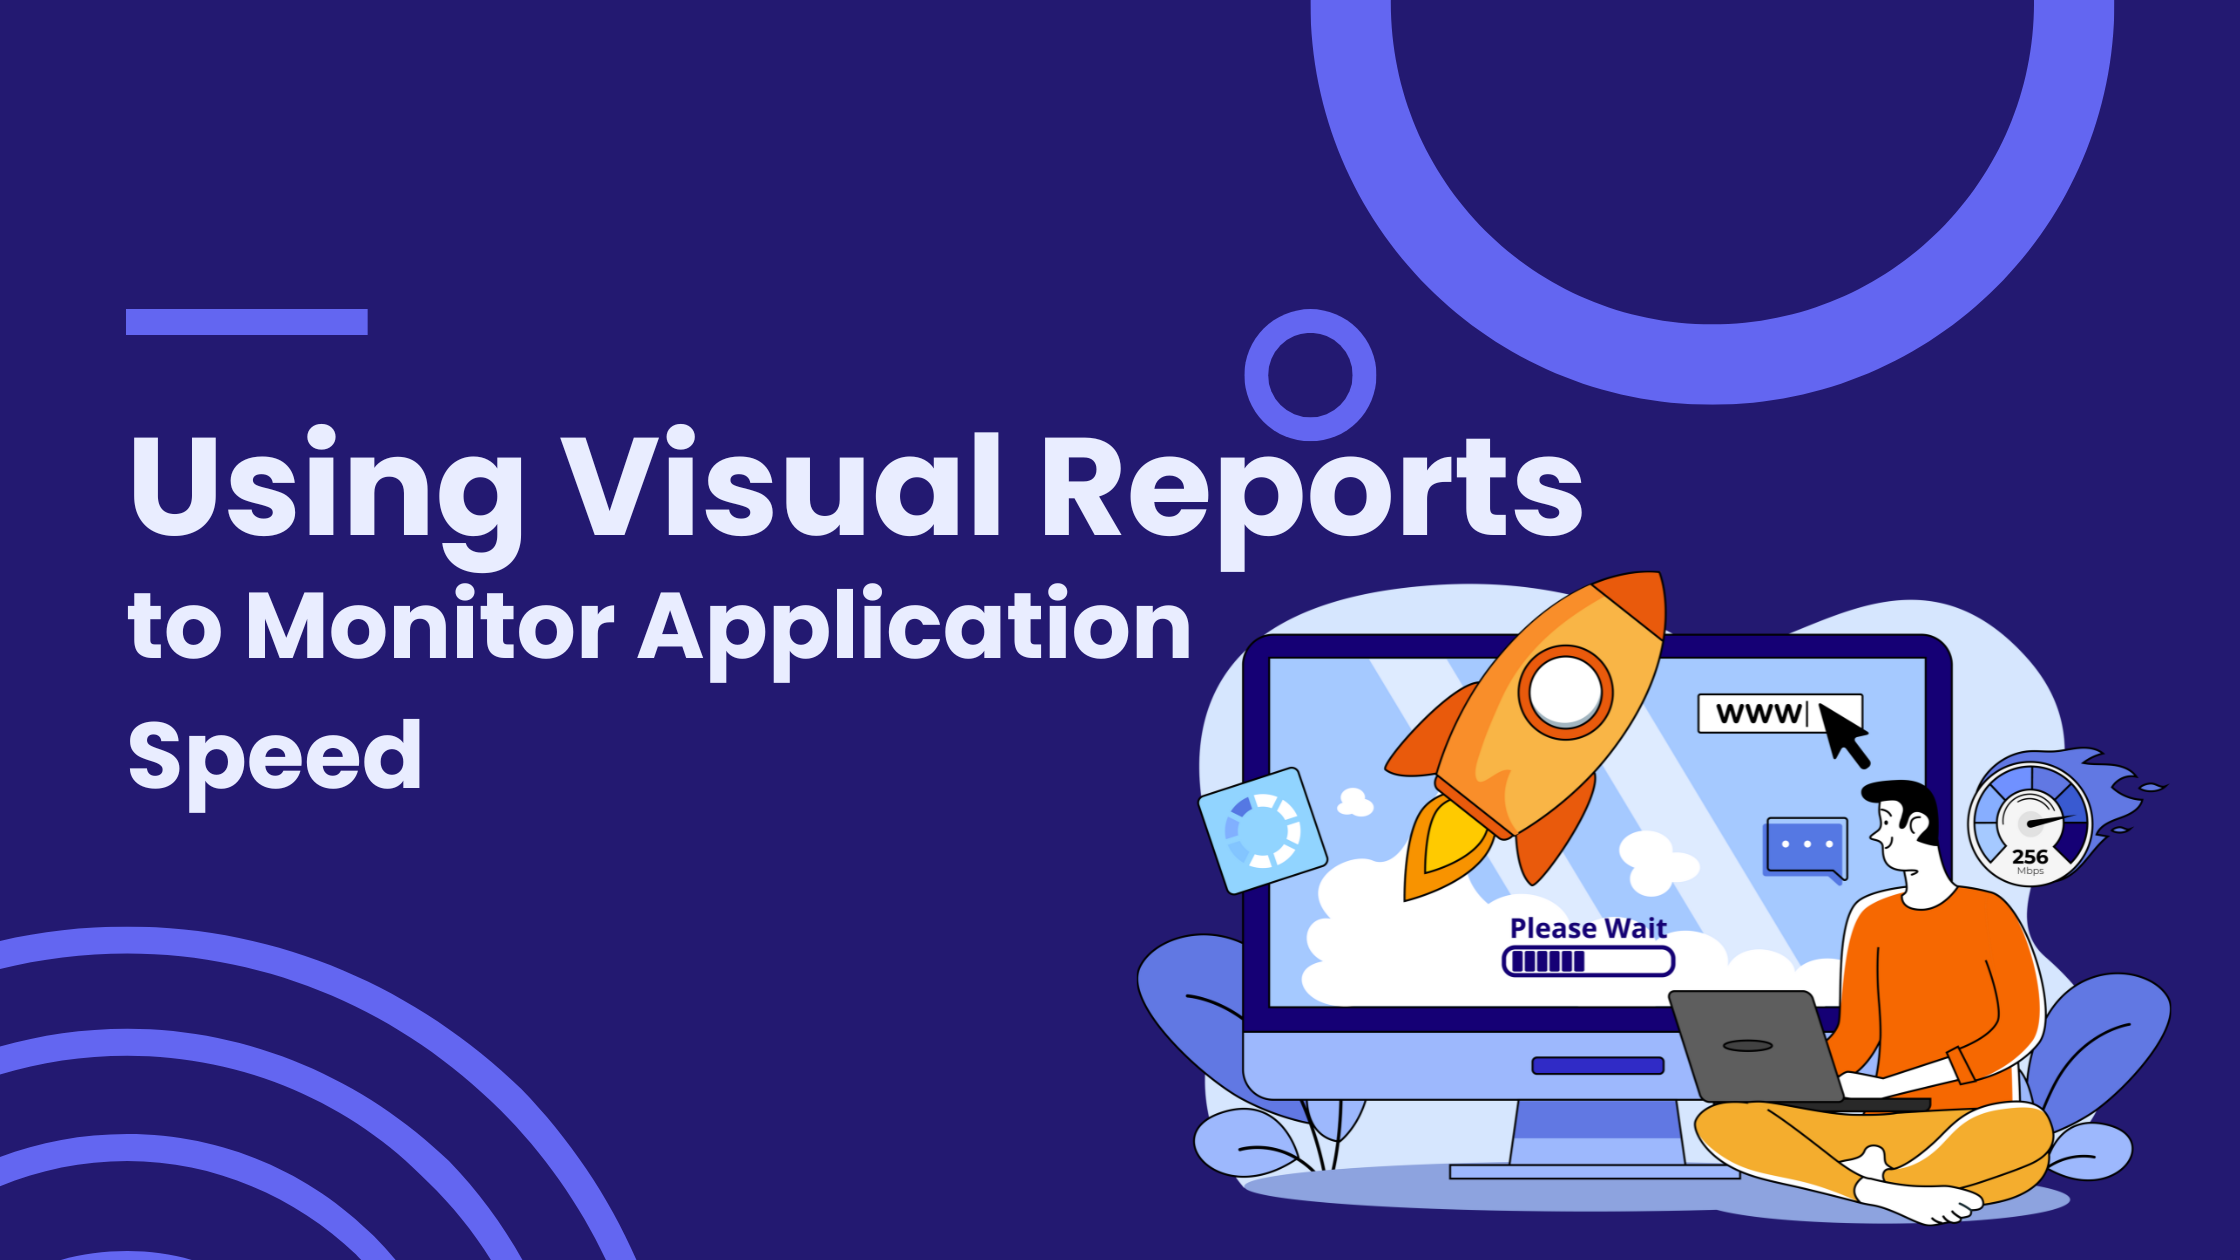
Quick Listen:
Application speed is paramount. Whether you're dealing with a website, a mobile app, or a cloud-based service, performance can make or break user experience. Slow loading times, glitches, or crashes are not only frustrating for users but can also lead to a significant loss in traffic, conversions, and customer loyalty.
As businesses strive to deliver high-performance applications, one of the most effective strategies is using visual reports to monitor application speed. These tools help developers and IT teams pinpoint problems, optimize performance, and ensure users have the best possible experience.
Visual Insights for Speed
At its core, visual reporting is all about transforming complex performance data into actionable insights. Instead of sifting through spreadsheets filled with numbers and percentages, developers can access clear, visual representations of their application's performance. These visual tools, including charts, graphs, and dashboards, allow teams to identify slowdowns, troubleshoot bottlenecks, and monitor response times in real-time.
By providing a holistic view of application speed, visual reports make it easier to understand where improvements are needed and how to implement those changes efficiently. The importance of visual monitoring cannot be overstated. A well-designed visual report offers clarity in decision-making and simplifies the process of tracking performance metrics.
Key metrics like load time, user interactions, error rates, and resource consumption become immediately understandable through graphical interfaces. This clarity helps ensure that performance issues are detected and resolved swiftly, minimizing the impact on users and reducing the likelihood of downtime. With the help of tools like Power BI's Performance Analyzer, businesses can gain immediate insights into how their applications are performing, allowing them to make quick adjustments before minor issues escalate into major problems.
APM Platforms and Beyond
While visual reports are incredibly useful, the tools that generate these reports are just as important. Application Performance Monitoring (APM) platforms play a critical role in tracking, analyzing, and optimizing the speed of applications. These platforms help organizations measure the responsiveness, uptime, and stability of their apps by collecting data on system performance and presenting it through visual reports.
One of the most popular APM platforms is Power BI. Known for its powerful data analytics capabilities, Power BI's Performance Analyzer can provide a detailed, interactive view of how an application performs, breaking down everything from CPU usage to network delays. With visual performance monitoring integrated into Power BI, teams can quickly identify performance issues, understand the root cause, and develop strategies to address them before users notice.
However, Power BI is far from the only tool available. A variety of APM solutions offer their own unique features tailored to different needs. For example, Application Performance Management's Visual Performance Suite focuses on helping businesses visualize key performance indicators (KPIs) through customized dashboards that are both informative and easy to navigate. These platforms offer a wealth of monitoring features, such as user behavior tracking, resource utilization analysis, and latency detection, allowing businesses to keep their apps running smoothly across different environments.
Another noteworthy option is Azure Monitor by Microsoft. Azure's suite of tools, including Application Insights, provides deep monitoring insights, allowing businesses to track application performance in real-time, pinpoint issues with speed, and optimize performance to deliver seamless user experiences. With cloud-based monitoring solutions like these, businesses can easily keep tabs on their applications, no matter where they are running.
Enhancing User Experience
When it comes to the user experience, speed is everything. Users expect apps and websites to load quickly and run smoothly, and any delays can lead to frustration and abandonment. Visual reports can be an incredibly powerful tool in ensuring that applications meet these expectations.
By continuously monitoring application speed with APM platforms, businesses can optimize the user journey by reducing lag, preventing errors, and minimizing downtime. For example, if users experience slow load times during peak traffic periods, developers can use performance monitoring tools to identify which parts of the app are causing the delays. Whether it's inefficient code, poorly optimized images, or server bottlenecks, visual reports make it clear where the problem lies.
In addition to optimizing load times, visual reports help businesses understand how their applications perform under different conditions. Through real-time monitoring, developers can gauge how apps behave across varying levels of traffic, network speeds, and hardware configurations. This helps businesses optimize the user experience for a wide range of devices, ensuring that their applications are fast and responsive across the board.
Moreover, visual reports provide a proactive approach to problem-solving. By continuously tracking performance and offering immediate insights into areas of concern, these tools enable teams to make adjustments before problems even reach the user. For instance, if an application's server is starting to show signs of strain, developers can quickly intervene to optimize resources or deploy fixes before the user experiences a noticeable slowdown. This proactive approach not only improves user satisfaction but also strengthens the overall reputation of the application or platform.
Key Metrics to Track with Visual Reports
When using visual reports to monitor application speed, there are several key metrics that developers should focus on. These metrics provide a comprehensive view of the application's performance, allowing businesses to identify any areas that need attention.
- Load Time: This is one of the most important metrics to track. Users expect pages to load quickly, and any delays can lead to frustration and abandoned sessions. Visual reports make it easy to see how long it takes for a page or feature to load, helping developers identify slow areas and optimize them.
- Error Rates: Error rates track how often issues like crashes or bugs occur. By visualizing error data, developers can identify recurring problems, prioritize fixes, and ensure a smoother experience for users.
- Server Response Time: Monitoring server response time is crucial for understanding how quickly the server is responding to user requests. If response times are too slow, users will experience delays, which could lead to frustration and user churn.
- Resource Consumption: Visual reports also help businesses track how much CPU, memory, and bandwidth their applications consume. High resource consumption can indicate inefficiencies in code or infrastructure that need to be addressed.
- User Behavior: Tracking how users interact with an application can provide valuable insights into performance. For instance, if users frequently abandon a process or feature, it could be a sign that the app is running slowly or inefficiently at that point. Visual reports help developers spot such patterns and optimize accordingly.
By focusing on these metrics, businesses can create a more efficient and enjoyable experience for their users, ultimately improving engagement and retention.
Why Visual Reports Are the Future of Application Monitoring
The digital landscape is more competitive than ever. Applications are expected to perform flawlessly, and even small performance hiccups can lead to dissatisfied users. As businesses face increasing pressure to deliver high-quality digital experiences, visual reports offer a way to stay ahead of potential issues.
Visual monitoring tools make it easier for developers to track performance, identify bottlenecks, and optimize their apps in real-time. By offering a clear, easy-to-understand view of key performance indicators, these tools empower developers to make data-driven decisions that improve both the user experience and the overall efficiency of the application.
Moreover, visual reports help organizations adopt a more proactive approach to monitoring. Instead of waiting for users to report issues, developers can spot and address performance problems before they become noticeable to the end user. This shift from reactive to proactive monitoring is essential in maintaining a competitive edge in today's fast-moving digital world.
Data-Driven Efficiency
In the quest for application efficiency, visual reports have become an indispensable tool for monitoring and optimizing performance. By turning complex data into visual insights, these tools provide developers with the clarity they need to make informed decisions and address issues before they impact users. Whether it's identifying slow load times, optimizing server response, or tracking error rates, visual reports empower businesses to deliver high-performance applications that meet the demands of modern users.
As applications grow more complex and users expect ever faster experiences, the role of visual performance monitoring will only continue to grow. By embracing these tools, businesses can stay ahead of the curve, ensuring that their applications perform at their best and provide users with seamless, enjoyable experiences.
You may also be interested in: Effective Test Case Review Process | Best Practices
Book a Demo and experience ContextQA testing tool in action with a complimentary, no-obligation session tailored to your business needs.