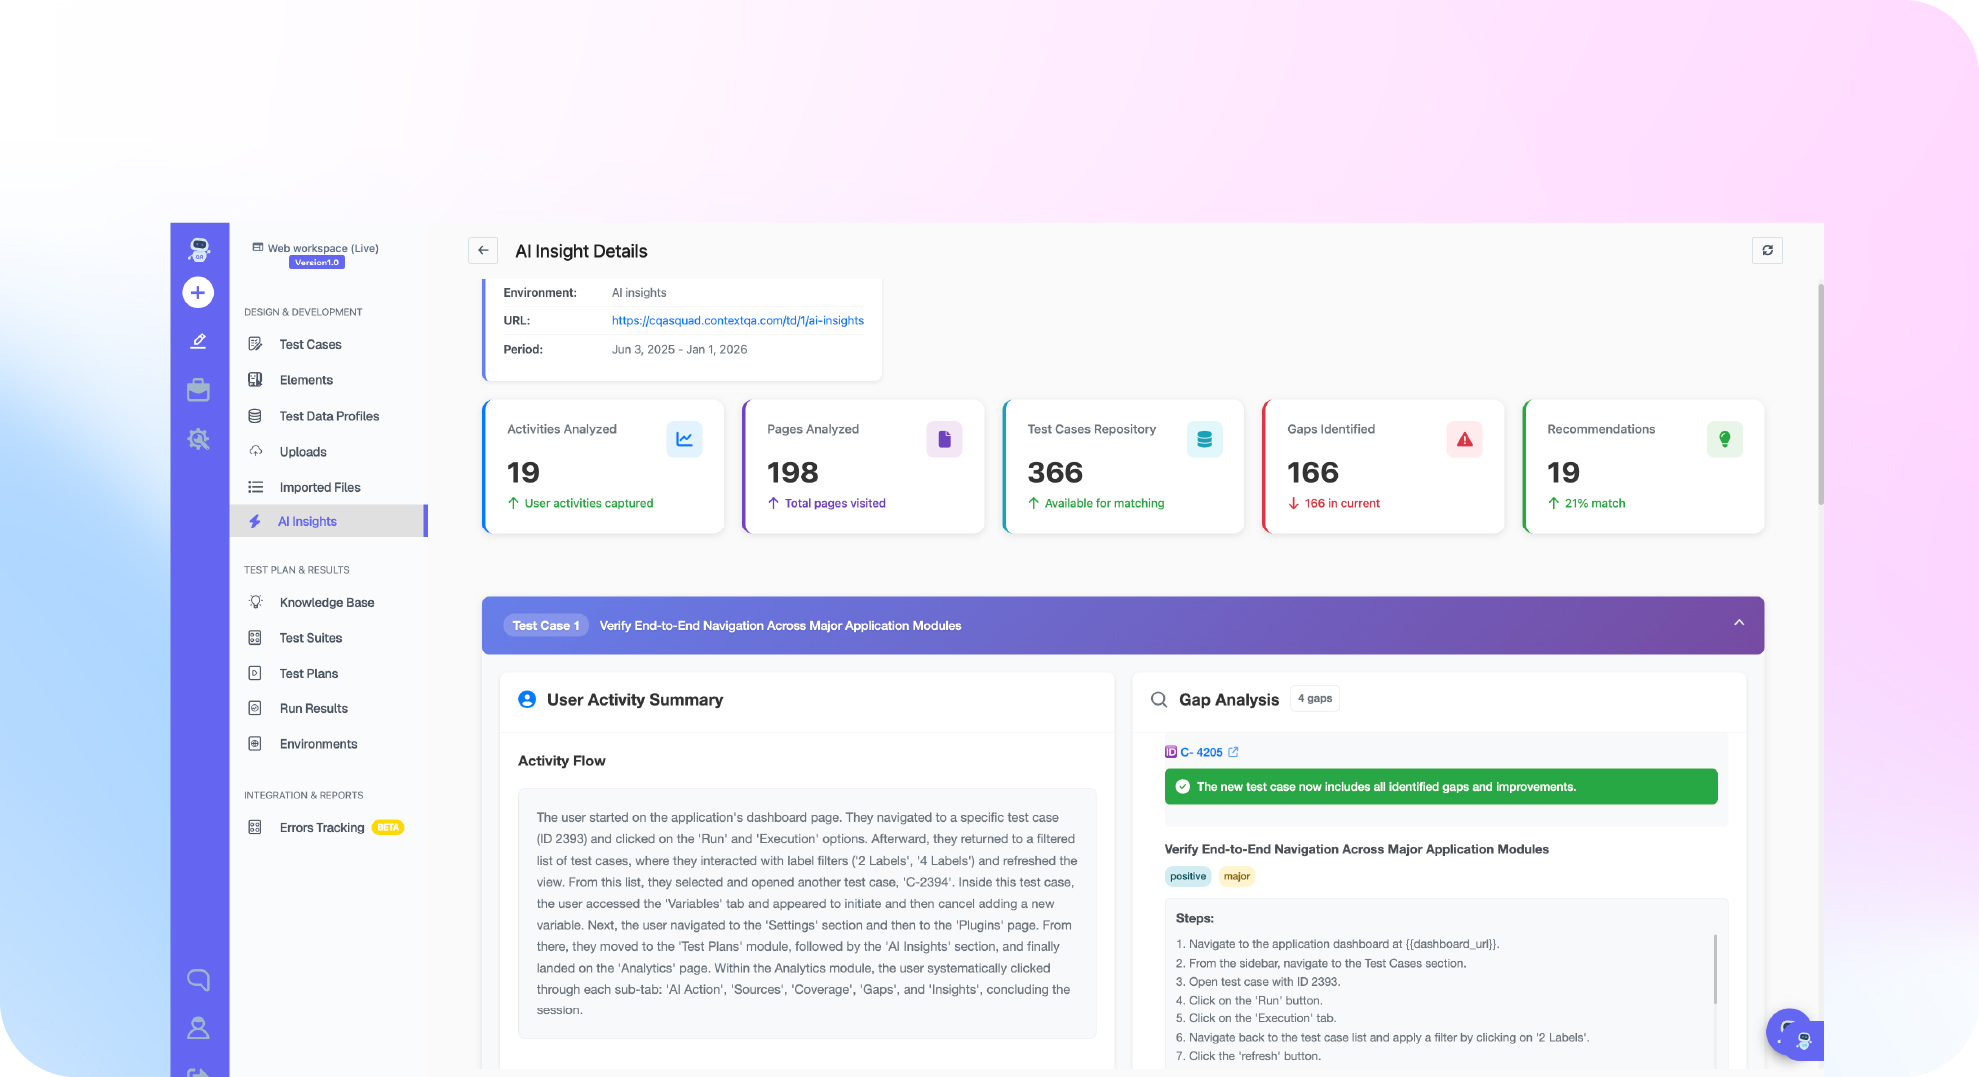
TL;DR: Forrester’s Total Economic Impact research documents test automation delivering 4.5x ROI over three years for enterprises, with an average payback period of 13 months. The largest value driver is not speed. It is defect avoidance. NIST data shows production defects cost 30 times more to fix than defects caught in development. This guide provides the calculation framework, the analyst benchmarks, and the inputs your business case actually needs.
The Number Your Finance Team Will Ask For First
Test automation is one of the few engineering investments where the business case should be straightforward. The inputs are measurable. The outcomes are documented across decades of industry research. And yet most ROI presentations get challenged because they leave out maintenance costs, use optimistic defect rates, or cannot point to third-party benchmarks for their assumptions.
Forrester’s Total Economic Impact methodology is the most credible framework available for this calculation. The TEI studies commissioned by enterprise software vendors give you the structure: benefits minus costs minus risk, discounted over a three-year horizon. The 4.5x ROI figure comes from Forrester’s composite enterprise analysis. Your number will be different. But the framework is the same.
NIST’s landmark research on software defect costs provides the most important single input in any test automation business case: the cost of a defect at each stage of the development lifecycle. Unit testing: approximately $25. Integration testing: $150. System testing: $600. Production: $10,000 or more when you include customer impact, incident response, and reputational cost. Those numbers have been cited in hundreds of academic and industry studies since their publication because they hold up across industries and technology types.

The business case math is simple: if your automation program catches 100 defects per year that would otherwise reach production, and the average production defect cost is $10,000, you have $1 million in avoided cost. That is the numerator. Everything else — labor savings, cycle time, deployment frequency — is additive.
Capgemini’s World Quality Report, surveying 1,750 IT leaders annually, documents that organizations spend an average of 28 percent of their IT budgets on quality assurance. Test automation is the top lever cited for reducing that percentage while maintaining or improving coverage. The organizations in the top quartile of automation maturity spend 18 to 20 percent on QA. The bottom quartile spends 32 to 40 percent. The difference is automation coverage and defect escape rate.
Definition: Test Automation ROI Test automation ROI measures the financial return generated by investing in automated testing relative to the cost of that investment. NIST defines the framework as: (Value of Defects Avoided plus Labor Cost Reduction plus Cycle Time Improvement) minus (Tool Costs plus Implementation Costs plus Ongoing Maintenance Costs), divided by Total Investment. The ratio is typically measured over a three-year horizon using Forrester’s Total Economic Impact methodology.
Quick Answers
Q: What is the average ROI of test automation? A: Forrester’s TEI research documents 4.5x ROI over three years for enterprise programs with an average payback period of 13 months. Small and mid-size teams see positive ROI at 18 to 24 months depending on initial test volume.
Q: What is the single largest ROI driver in test automation? A: Defect avoidance. NIST data documents that production defects cost 30 times more to fix than defects caught in development. Catching more defects earlier is worth more than any labor efficiency gain.
Q: Why do test automation ROI calculations often fail to deliver? A: They exclude maintenance costs. Test script upkeep averages 30 to 40 percent of initial implementation cost annually. Capgemini’s World Quality Report documents this consistently. A business case that ignores maintenance overstates three-year ROI by 30 to 50 percent.
The ROI Calculation Framework: Inputs, Benchmarks, and Common Errors
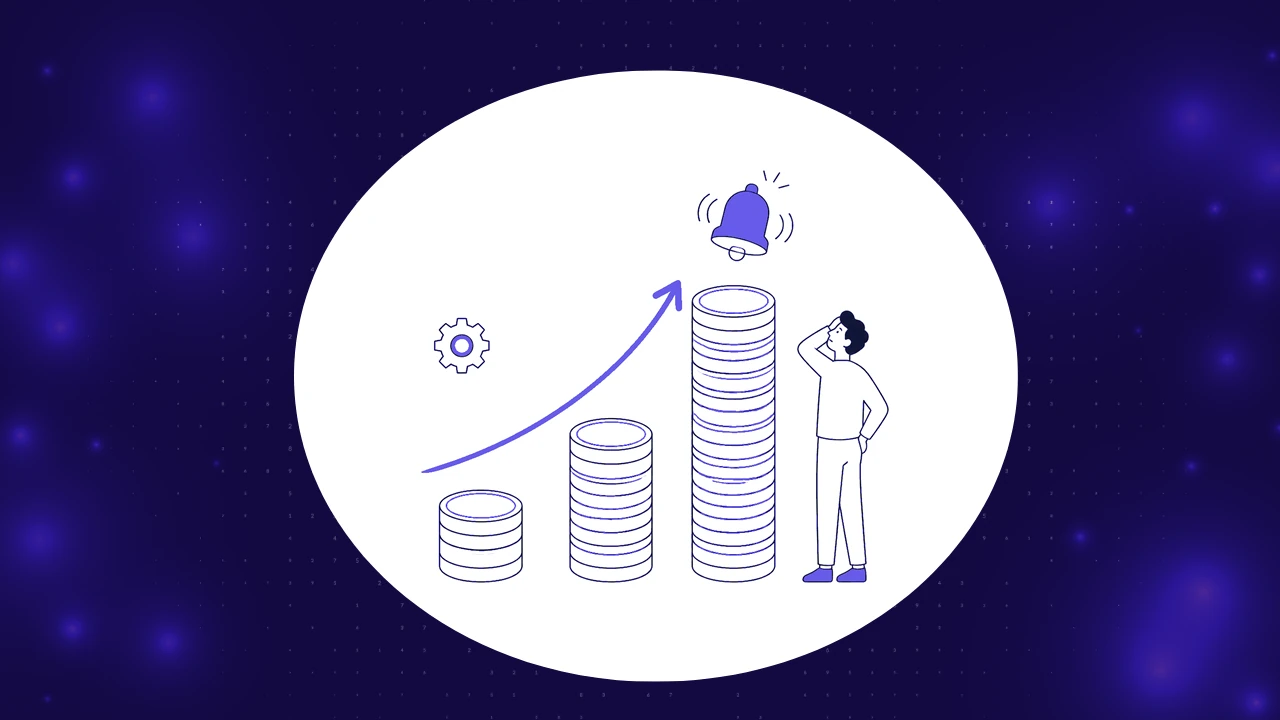
A defensible test automation ROI model has six input categories. Each one needs a source, either internal measurement or a published benchmark. Undocumented assumptions are what get business cases rejected.
Input 1: Current Manual Testing Cost
Calculate the hours your QA team spends on manual regression testing per release cycle. Multiply by the fully-loaded hourly cost of a QA engineer in your geography. Stack Overflow’s Developer Survey 2024 provides median engineer compensation data by region that can anchor this calculation. Annualize based on your release frequency.
Input 2: Defect Escape Rate and Production Defect Cost
How many defects reach production per quarter? What is the average incident resolution cost? If you do not have internal data, use NIST’s $10,000 average as a conservative floor. Critical production defects affecting revenue or security cost substantially more.
IBM Systems Sciences Institute’s defect cost escalation data corroborates NIST and adds the integration-to-production ratio: the cost of a defect increases by roughly 6 times at each subsequent phase. This compounding escalation is what makes defect avoidance the dominant ROI driver.
Input 3: Automation Implementation Cost
Tool licensing, engineering time to build the initial framework, training, and integration with CI/CD pipelines. Be honest here. Most teams underestimate initial build time by 40 to 60 percent. A realistic estimate for a team building a 200-test suite from scratch is 3 to 4 engineer months, not 3 to 4 weeks.
Input 4: Annual Maintenance Cost
This is the input most business cases omit. Capgemini’s World Quality Report documents test maintenance consuming 30 to 40 percent of QA engineering capacity in organizations running active UI automation. Model this as 30 percent of initial build cost annually as a minimum. If your application changes frequently and you do not have locator stability practices in place, model 40 percent.
For teams evaluating AI-assisted platforms that reduce maintenance overhead, this is where the cost differential compounds over three years. A platform that cuts maintenance by 50 percent changes the ROI model substantially by year two.
Input 5: Cycle Time Value
How much is one day of faster release cycles worth to your business? McKinsey’s research on developer velocity documents that organizations with mature automation reduce time to market for new features by 20 to 40 percent. Translate that into revenue timing: if your product generates $50K per day in new revenue from feature releases, a two-week acceleration is worth $700K annually.
Input 6: Risk Adjustment
Forrester’s TEI framework risk-adjusts all benefit estimates. Typical risk adjustments reduce benefits by 10 to 25 percent to account for implementation delays, lower-than-expected defect rates, and attrition of engineers who built the system. Apply a 15 percent risk reduction to your total benefit estimate as a conservative floor.
| ROI Component | Typical Range | Primary Source | Common Mistake |
| Defect avoidance value | $500K to $2M annually for 500 tests | NIST production defect cost data | Using internal defect counts without production cost data |
| Manual testing labor reduction | 20 to 40 percent of current QA spend | SmartBear automation maturity data | Assuming 100 percent replacement rather than augmentation |
| Cycle time value | 2 to 4 week release acceleration | McKinsey developer velocity research | Leaving cycle time out entirely because it is hard to quantify |
| Implementation cost | 3 to 4 engineer months for 200 tests | Internal estimate plus industry benchmarks | Underestimating by 40 to 60 percent |
| Annual maintenance cost | 30 to 40 percent of build cost | Capgemini World Quality Report | Omitting maintenance from the three-year model entirely |
| Risk adjustment | Reduce total benefits by 10 to 25 percent | Forrester TEI methodology | Using point estimates instead of ranges |
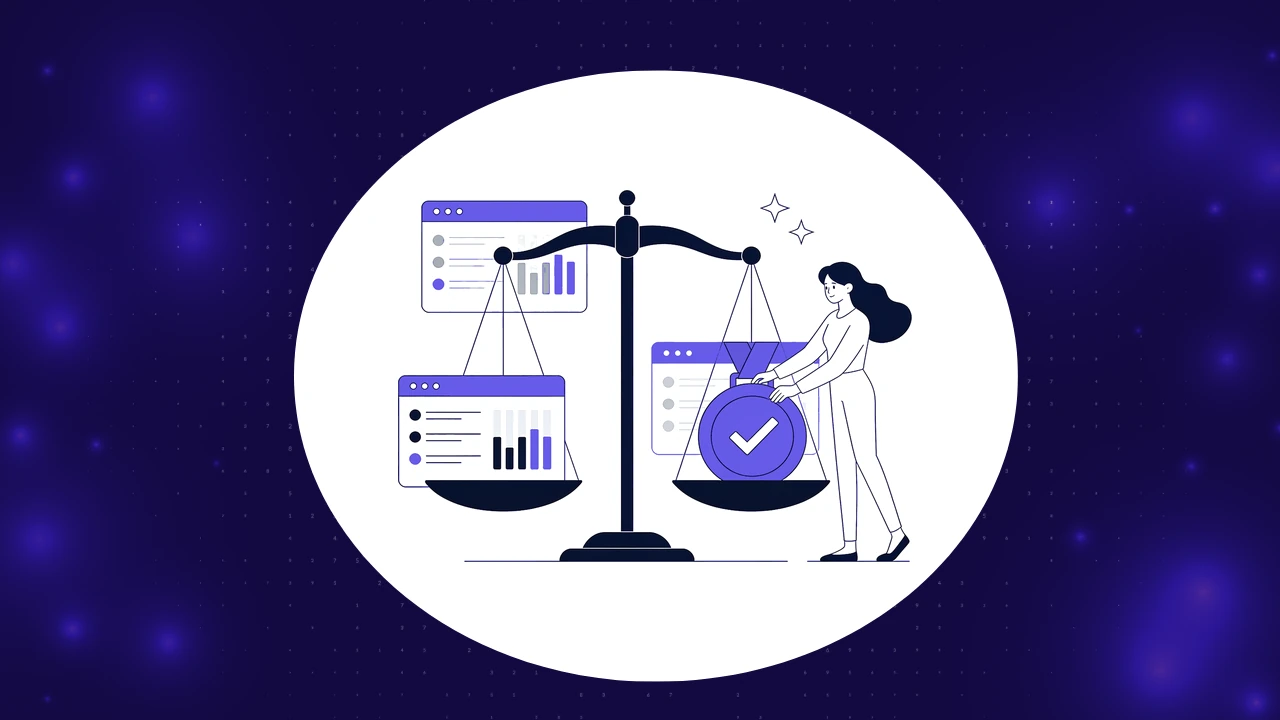
Definition: Total Economic Impact (TEI) Total Economic Impact is Forrester’s proprietary ROI methodology for enterprise technology investments. TEI calculates return across four dimensions: benefits (cost reductions and efficiency gains), costs (full implementation and ongoing costs), flexibility (option value from future capability), and risk (probability-adjusted ranges). TEI is the standard citation in enterprise procurement and CFO-level business cases for software tooling and is used by most major test automation vendors when commissioning third-party ROI validation.
Why DORA Metrics Change the ROI Conversation
Most test automation business cases focus on QA department costs. DORA’s State of DevOps research reframes the ROI story at the organizational level.
DORA documents that elite-performing engineering organizations deploy 182 times more frequently than low performers and have change failure rates of under 15 percent versus 46 to 60 percent for low performers. The elite organizations share specific practices: automated testing is one of the most strongly correlated capabilities with elite performance.
The ROI implication is significant. If deploying more frequently captures more market opportunities and reduces the cost of large, risky releases, the business value of automation extends well beyond the QA budget. McKinsey’s developer velocity research connects high-velocity software delivery to revenue growth, quantifying the value of faster feature delivery at 20 to 40 percent time-to-market improvement for high-automation organizations.
Gartner’s software testing market research identifies test automation as a foundational capability in software engineering, not merely a QA efficiency tool. The Gartner analysts frame automation maturity as a prerequisite for continuous delivery at scale, which is the operating model for modern software businesses.
Their Quality Assurance community discussion on measuring automation ROI surfaces a practical point that analyst reports often miss: teams that present ROI only in terms of QA cost reduction get smaller budget approvals than teams that connect automation to deployment frequency and revenue velocity. The framing matters as much as the number.
For teams building a shift left strategy that strengthens the business case further, the companion guide on shift left testing strategy covers the defect avoidance amplification that earlier testing produces.
The Honest Tradeoffs in Test Automation Investment
ROI is not linear with test count. Returns increase as automation coverage grows up to the point where maintenance overhead begins consuming the productivity gains. SmartBear’s quality data shows that teams past 500 tests with poor locator stability practices can see ROI decline in years two and three as maintenance costs accelerate. The ROI curve eventually flattens and turns negative without maintenance discipline.
AI-assisted automation shifts the curve but does not eliminate it. Platforms that reduce maintenance overhead extend the ROI-positive range substantially, but they come with higher licensing costs that must appear in the model. The net benefit is usually positive by year two, but the first-year cost profile looks worse than a lower-cost tool that accumulates higher maintenance debt.
Automation cannot recover ROI from fundamental test design problems. If the test suite tests implementation details rather than behavior, it fails on every refactor and generates maintenance costs without corresponding defect coverage value. Tool quality cannot compensate for test architecture quality.
How to Build the Business Case in Under Two Hours
Step 1: Pull your last four quarters of production incident logs. Count defects attributed to software bugs. Calculate the average resolution time and multiply by engineer cost plus estimated customer impact. This is your current annual defect cost. Target: 45 minutes.
Step 2: Time your last three regression test cycles. Multiply hours by engineer count by hourly cost. Annualize. This is your current manual regression cost. Target: 20 minutes.
Step 3: Request a benchmark comparison from SmartBear’s State of Quality report on automation rates and defect escape rates for teams at your company size. This validates your assumptions against industry norms. Target: 30 minutes.
Step 4: Build a three-year model using the six-input framework above. Use Forrester’s 4.5x benchmark as a sanity check. If your model produces 8x or higher, your maintenance cost estimate is probably too low. Target: 45 minutes.
Step 5: Read the DORA deployment frequency data and calculate what a one-tier improvement in deployment frequency is worth in revenue timing for your product. Add this as a separate benefit line with a risk adjustment of 50 percent. This is the number that gets engineering leadership engaged. Target: 30 minutes.
Step 6: Review ContextQA’s AI test automation platform for the maintenance cost reduction data point. The Pilot Program benchmark documents 40 percent efficiency improvement in 12 weeks, which provides a verified input for year-two maintenance cost assumptions. Target: 30 minutes.
The Bottom Line
Test automation ROI is well-documented, measurable, and defensible with public benchmark data. Forrester’s 4.5x over three years is the anchor number. NIST’s defect cost escalation data is the most important single input. DORA’s deployment frequency correlation is the number that takes the business case from a QA efficiency argument to an engineering velocity argument.
The business cases that fail are the ones that overestimate labor savings, underestimate maintenance costs, and present point estimates instead of risk-adjusted ranges. Build the model with the six inputs above, use public benchmarks to defend each assumption, and the calculation will hold up to CFO scrutiny.