
TL;DR: Testing analytics turns test run data into release decisions. That data includes pass rates, how often flaky tests fail, failure causes, execution time, and coverage of each code change. Useful analytics link every failure to a commit, a pull request, and evidence such as logs and screenshots. Flaky tests add real noise: Google reported that about 1.5% of all its test runs returned a flaky result (Google Testing Blog, 2016). Ship, the ContextQA autonomous quality engineer, runs impact analysis and targeted regressions on every pull request. When someone reports a bug, Ship reproduces it and hands engineers the evidence.
Most CI reports show only red and green checks. From those you can't tell whether a failure is a real regression, a flaky test, or noise. This guide explains how to read pass, flake, and risk data from your test runs, so you can decide whether to merge, rerun, or fix.
Quick answers
How is test run analytics different from a pass/fail report? A report tells you whether one run passed. Analytics tracks results across many runs: pass rate over time, which tests fail intermittently, which code areas fail most, and how long runs take. QA leads use reports to debug a single run. They use trends to decide what to fix, what to quarantine, and whether a release is ready.
How should I read a failed check on a pull request before I block the merge? Decide whether it is a regression, a flaky test, or an environment problem. Compare the failing step with the test's recent history on main, then check screenshots, logs, and the diff. For bugs reported in your tracker, Ship finds the likely root cause and hands engineers the evidence. Block the merge for a confirmed regression. Log flaky tests and fix them separately.
Which metrics should an engineering manager review before signing off on a release? Review the pass rate of tests covering the changed code, open failures on critical flows, tests that recently flipped between pass and fail, and changed areas with no coverage. A high pass rate across the whole suite can hide one failing checkout test. Read results for the changed scope and open the run evidence behind any number.
What is testing analytics?
Testing analytics is the practice of collecting and interpreting data from test runs, such as pass rates, failure causes, flaky tests, run durations, and coverage. Teams use it to make release decisions from evidence instead of gut feel. It shows where quality is improving and where it is slipping.
It differs from a single test report in three ways:
- It spans many runs. One red build is an event. The same test failing on 6 of the last 20 runs is a pattern.
- It ties results to code changes. Each failure links to the commit or pull request that introduced it.
- It separates defects from noise. A flaky test passes and fails with no code change. Analytics keeps those failures apart from real regressions.
Without that context, engineers rerun jobs until they go green, stop trusting the suite, and let regressions reach production. Ship runs impact analysis and targeted regressions on each pull request before merge. For bugs reported in Jira, Linear, Slack, or a service desk, it finds the likely root cause and hands engineers the evidence.
What can test run data tell you?
Run data becomes a release decision when you track a few specific metrics. Together they show whether a build is safe to ship, which tests fail without any code change, where defects slip past the suite, and which flows have no coverage.
- Pass rate: Passed tests divided by executed tests, tracked per branch or release. A falling pass rate on
mainpoints to a regression. - Flaky test rate: The share of tests that both pass and fail on the same commit. Quarantine flaky tests before engineers learn to ignore red builds.
- Defect escape rate: Bugs found in production divided by all bugs found for a release. It shows whether the suite catches what users would hit.
- Coverage mapped to risk: Line coverage alone can mislead. Map tests to requirements and changed files to find gaps in high traffic flows.
- Failures tied to changes: Each failure should link to the pull request that caused it, with evidence attached.

Why does it matter in 2026?
Test suites now produce more results than teams can review by hand. When a build goes red, engineers need to know quickly whether the code broke, a test is flaky, or the environment failed. Analytics turns raw pass and fail logs into trends, likely root causes, and evidence for a release decision.
Flaky tests show the scale of the problem. Google reported that almost 16% of its tests showed some flakiness (Google Testing Blog, 2016). At that rate, an overall pass rate hides which failures deserve an engineer's time.
When you compare tools, check four things:
- Flake detection: It separates flaky failures from real regressions.
- Commit linking: It traces each failure to the change that caused it.
- Evidence: It attaches screenshots, logs, and step history to each failure.
- Timing: Results reach the pull request before merge, not a dashboard after release.
How does test run analytics work?
Collection, correlation, and classification do most of the work. The raw output of every run is captured, each result is linked to the code change behind it, and failures are sorted by cause. Then pass rates, flaky tests, and time to diagnose move out of CI logs and into release decisions.
- Capture run data. Each CI job writes results, usually as
junit.xmlor JSON, with test ID, status, duration, commit SHA, and branch. Use--junitxml=report.xmlin pytest or--reporter=junitin Playwright. - Correlate to changes. Link every result to its pull request, ticket, and environment so a failure points to a specific change.
- Classify failures. Sort failures into product bugs, test defects, environment errors, and flaky retries. A test that passes on rerun counts as flaky, not as a clean pass.
- Trend per sprint. Track pass rate, flake rate, and mean time to diagnose across sprints instead of reading single runs.
- Report ROI to executives. Compare triage hours, escaped defects, and merge to release time before and after automation, over at least two quarters.
For reported bugs, Ship supports triage: it reproduces bugs reported in Jira, Linear, Slack, or a service desk, and hands engineers the likely root cause with evidence.
Which approach fits your team best?
Teams with platform engineers to spare can build analytics from CI data themselves. Small product teams that want impact analysis and targeted regressions on every pull request without maintaining a pipeline fit a self serve tool like Ship. Teams just starting out can use CI logs and a spreadsheet until run volume makes that unworkable.
| Option | Best for | Pricing model | Notable tradeoff |
|---|---|---|---|
| CI logs plus spreadsheet | Early teams | Free | Manual, no trend history |
Homegrown dashboard on junit.xml | Teams with platform engineers | Engineer time | You maintain ingestion and schema |
| Framework reporting plugin | Single framework suites | Usually open source | Per run view, weak cross run trends |
| Ship | Small product teams | Self serve, free start | Separate from the enterprise platform |
Detecting flaky tests: store junit.xml from every run and track how often each test flips on the same commit. Move frequent flippers to a non blocking job, then fix the cause, such as shared state, fixed sleeps, or colliding test data.
How does Ship turn run data into merge decisions?
Ship, the ContextQA autonomous quality engineer, tests each code change instead of relying on a separate reporting project. On every pull request, Ship runs impact analysis and targeted regressions before merge. When someone reports a bug, Ship reproduces it, finds the likely root cause, and gives engineers the evidence.
Here is how a change moves through Ship:
- A developer opens a pull request. Ship runs impact analysis on the change.
- Ship runs targeted regressions before merge.
- Someone reports a bug in Jira, Linear, Slack, or a service desk. Ship reproduces it and identifies the likely root cause.
- Engineers get the evidence with the finding. Triage starts from a reproduction, not a vague ticket.
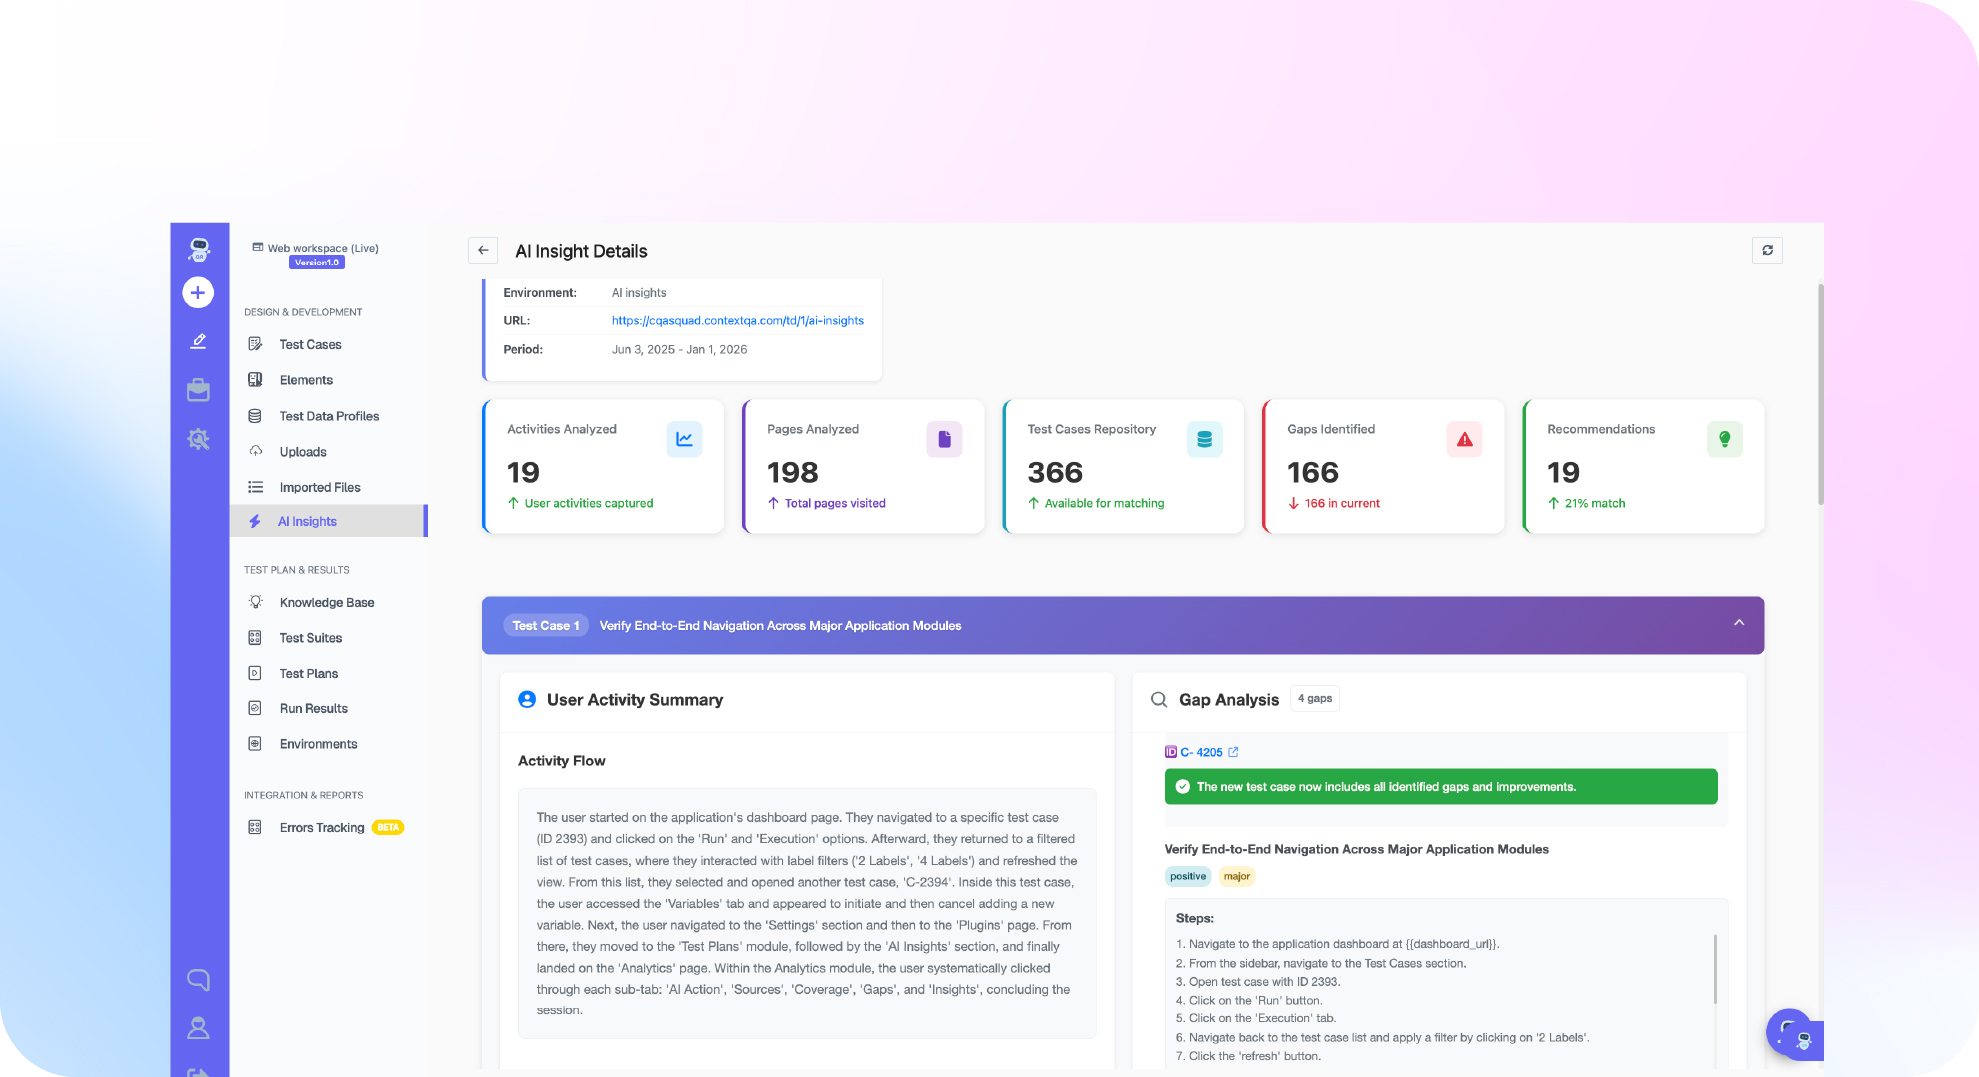
Dashboards across the whole suite belong to the ContextQA enterprise platform, not Ship. The platform's reporting overview and analytics dashboard cover execution trends, coverage views, and risk based testing, alongside platform root cause analysis and impact analysis. If you need that view across web, mobile, API, and enterprise apps, you can book a demo.
Want every pull request tested before merge? See how Ship runs impact analysis and targeted regressions on each pull request and reproduces reported bugs: get started free, no credit card needed.

What should you do now to get started?
Pick three or four metrics tied to release decisions. Publish CI results in a machine readable format and separate flaky failures from real regressions. Then build one release readiness view per pipeline and review it every sprint.
- Export JUnit XML from every CI job, tagged with commit SHA, branch, and pipeline ID.
- Write down definitions for pass rate, flaky rate, and time to diagnose.
- Quarantine tests that pass and fail on the same commit, with an owner and a fix date.
- Map critical user flows to tests and list the flows with no tests.
- Set a release gate, such as zero failing critical path tests, and post its status on the pull request.
Bottom line
Run data is only useful when it changes a release decision. Treat pass rates, flaky test trends, and risk signals as starting points, then open the underlying runs, screenshots, and step logs before you sign off on a merge. Ship runs impact analysis and targeted regressions on every pull request. Start with one repository and review what Ship flags next.
Sources
Check each source before you copy a command, because tool documentation changes between releases and flags can be renamed.