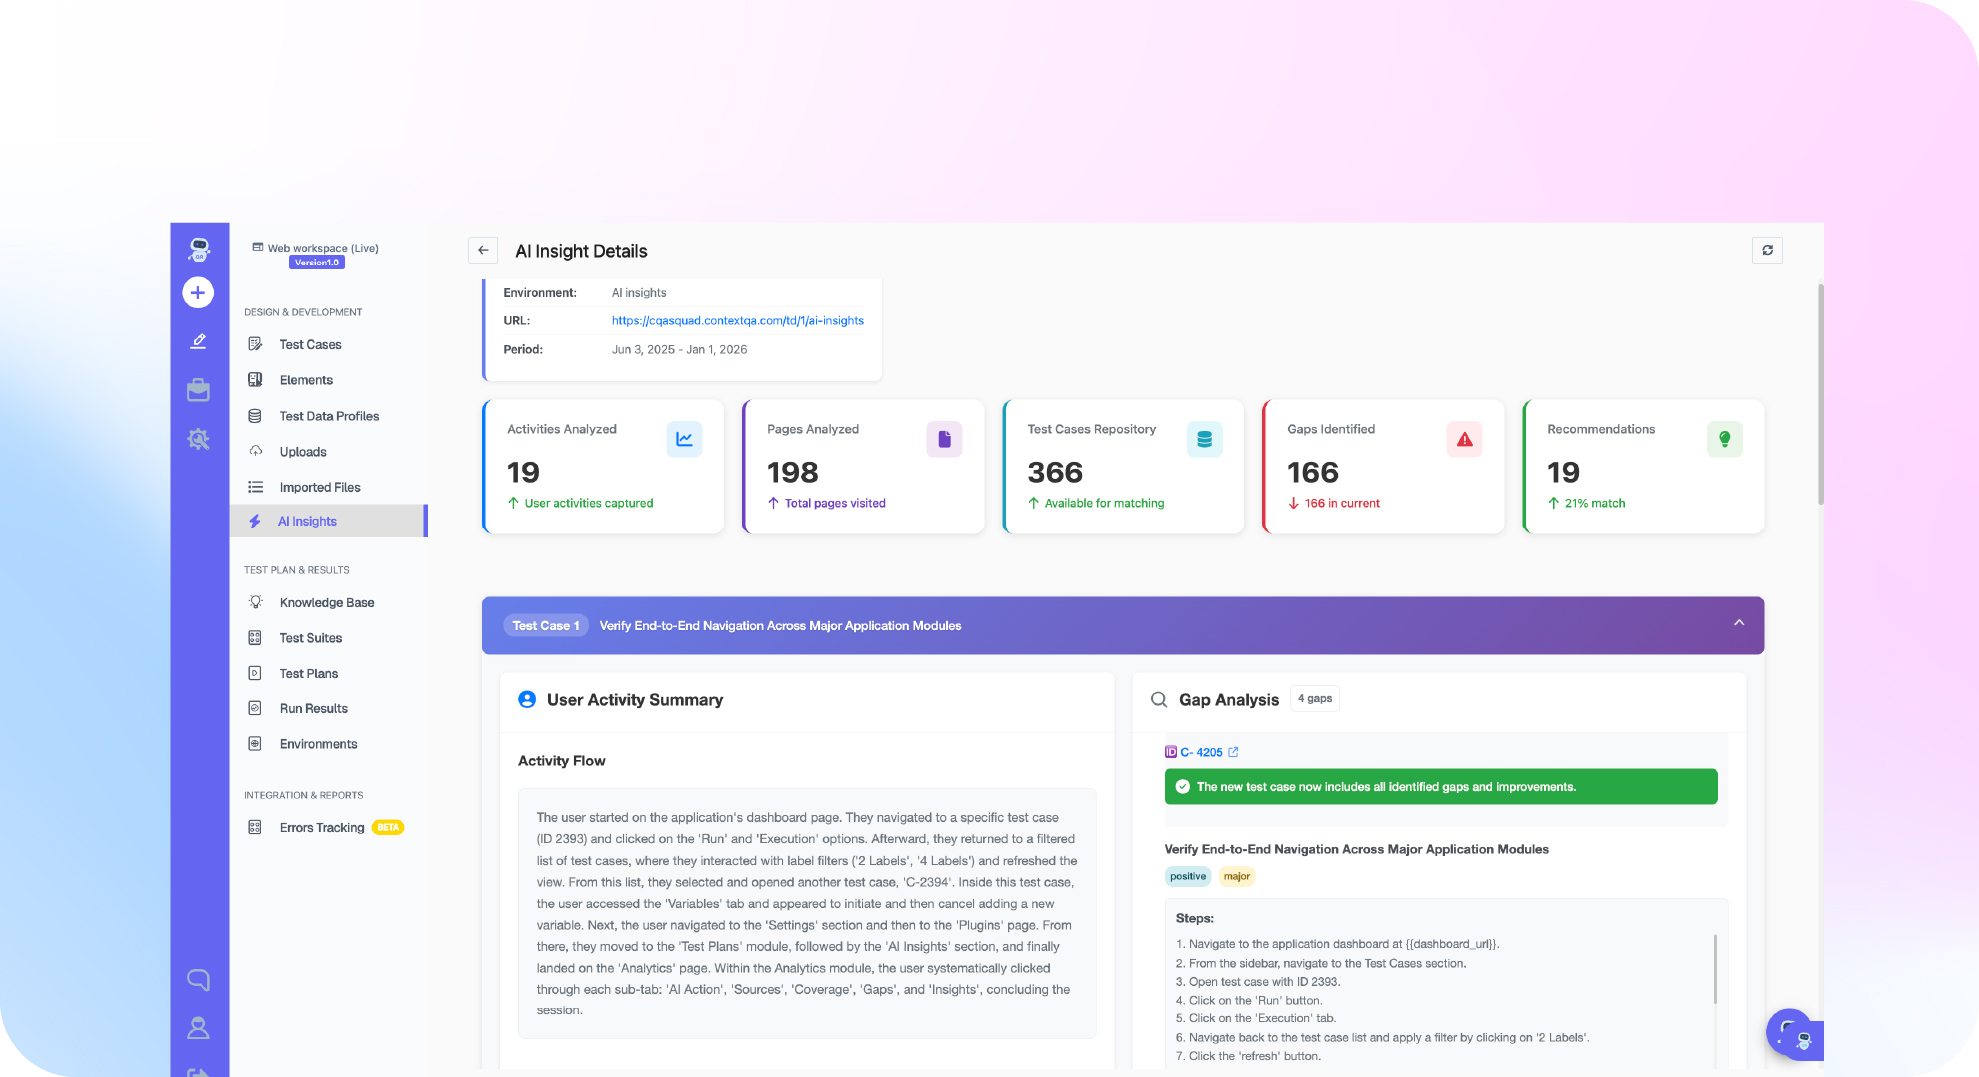

TL;DR: A QA dashboard is one view of test coverage, run results, active automated work and linked defects. It exists to help a person decide whether a release is ready. A useful dashboard links every pass count to the run behind it: the environment, browser or device, step results, screenshots, traces, and rerun or self healing history. Without that link, flaky tests get reported as regressions, and real regressions get rerun until they pass. In Ship, ContextQA's autonomous quality engineer, the dashboard ties coverage and issues directly to that run evidence.
A QA dashboard full of green counts can still hide a broken release. A pass total doesn't tell you which environment ran, which step failed first, or whether self healing fixed the result without anyone noticing. This guide shows how to read the Ship dashboard in order, from coverage through to run evidence, before you make a release decision.
Quick answers
Why can a dashboard show a high pass rate when the release is still risky? Aggregate pass counts don't show where a run executed, which step failed first, or whether self healing or a rerun turned a failure green. A release decision needs the exact run: its trigger, environment, browser or device, step results, screenshots, video, trace, and console and network logs. In Ship, open that run from the dashboard before anyone signs off.
In what order should a QA lead read a Ship dashboard before a release? The Ship dashboard guide gives the order. Start by confirming the workspace and environment. Then check the AQE Terminal for autonomous work that is running, waiting, completed or blocked. Compare web, API and mobile coverage with the journeys that matter, and wait for analysis to finish. Last, review linked issues and open the evidence for the exact run.
How should dashboard failures be tied to bug tracking so regressions do not return? Link every confirmed failure to a tracker item and a regression case. In Ship, select Report issue from a run result to create a tracker item, or open Issues to link an existing one. Removing a link in ContextQA does not delete the external issue. If an integration shows a connection warning, fix it before you trust the synced status.
What is a QA dashboard?
A QA dashboard is a single view of a test program's health: what is covered, what ran, what failed, and whether the evidence supports a release. A useful one links every number to the run that produced it, because a green pass count can hide a flaky test or a user journey nobody tested.
These are the metrics worth tracking:
- Test coverage: Web, API and mobile test inventory compared with the journeys and risks that matter most.
- Pass rate: Shown per run, environment, and browser or device, not only as one total.
- Defect density: Confirmed defects per module or feature area, tied to linked tracker issues.
- Flaky tests: Tests whose result changes on rerun, shown with their self healing history so recovered runs don't count as clean passes.
When you compare tools, check that each chart opens into run evidence. If a chart stops at the number, you can't verify it.
What can a test dashboard do?
A test dashboard turns raw results into signals for a release decision. With it, a QA lead can judge whether a build is ready without reading every CI log or opening every ticket.
- Coverage gaps: It compares web, API and mobile inventory with the user journeys and risks that matter most.
- Live activity: In Ship, the AQE Terminal shows which autonomous work is running, waiting, completed or blocked (Ship dashboard docs).
- Linked issues: From a run result,
Report issuecreates a tracker item, so a regression stays tracked until someone fixes it. - DIY builds: You can build one from tracker filter gadgets, a metrics tool on top of a results database, or a BI tool fed by exported reports. Your team then maintains the parsers and the schema.
- Versus test management: A test management tool stores test cases, plans and execution history. A dashboard reads that data to answer one question: can we ship?

Why does dashboard evidence matter in 2026?
Pipelines now run tests on every pull request, which produces more results than anyone can read one at a time. A pass count on its own hides flaky tests, environment failures and real regressions. A useful dashboard links each result to its run evidence, so a reviewer can tell these causes apart before approving a release.
Flaky tests are the main reason raw counts mislead. A flaky test is one that both passes and fails on the same code. Google's engineering productivity team reported that almost 16% of its tests showed some flakiness, and that 84% of observed pass to fail transitions involved a flaky test (Google Testing Blog, 2016).
Ship's dashboard puts evidence ahead of totals. Each run records its trigger, environment, step results, screenshots, video, trace, console and network logs, and its rerun and self healing history (Ship dashboard docs). Ship also points to a likely root cause, which a reviewer then checks against that evidence. ContextQA explains this on its root cause analysis page.
How does a test dashboard work?
A test dashboard pulls results from test runs, coverage inventory and linked issues into one view, then links every summary number back to the run that produced it. Reviewers read it from the top down and open the exact run before making a release call.
You can reuse Ship's documented reading order as a template:
- Confirm scope. Check the workspace and environment so nobody reports staging results as production readiness.
- Check active work. The AQE Terminal shows what Ship is running, waiting on, has completed, or is blocked on.
- Compare coverage to risk. Match web, API and mobile inventory with the journeys this release depends on.
- Wait for analysis. Crawl, code or change analysis has to finish before the counts are final.
- Review issues. Linked tracker items show which failures are tracked and which tests they affect.
- Open the run. Screenshots, video, trace, console and network logs, and self healing history show what actually happened.
When you report to executives, give them the decision, not the chart: which journeys passed in which environment, which failures have linked issues, and what evidence is still missing.
Which approach fits your team best?
Pick the dashboard type that matches where your evidence lives. Test case management dashboards suit manual and planned coverage, observability dashboards suit debugging automated runs, and open source report generators suit tight budgets. Ship suits small product teams that want every pull request tested, with run evidence attached.
- Test case management dashboards: Track planned cases against executed ones. Evidence from automated runs lives in a different tool.
- Test observability dashboards: Collect automated runs and flaky test trends from your existing framework. You still write and maintain every test.
- Open source report generators: Free, and usually published as an HTML report from a CI post step. You handle hosting, run history and access control yourself.
- Ship: Self serve, and free to start with no credit card. Its dashboard shows autonomous work in progress, web, API and mobile coverage, linked issues, and the evidence for each run.
Short version: If your team already maintains its own suite, an observability or open source dashboard is enough. If you want every pull request tested with evidence, without building that pipeline yourself, start with Ship.
How does Ship build its dashboard?
Ship, the ContextQA autonomous quality engineer, has a dashboard that summarizes coverage, autonomous work in progress, linked issues, and the run evidence a reviewer needs before deciding whether a build can ship.
Ship's documentation states the rule plainly: a count or a green label is not a release decision unless the environment and run evidence come with it. A spreadsheet rebuilt by hand every sprint can't meet that rule, because its pass counts carry no proof.
To give Ship your code context, optionally authorize GitHub or GitLab as the code provider during onboarding. Ship then tests each pull request before merge, using impact analysis to run targeted regressions on what changed. When a run fails, select Report issue to open a tracker item that stays linked to the failing run. You can also connect an AI agent through MCP (Ship setup guide, ContextQA MCP server). When the agent summarizes a run, ask it to keep observed facts separate from hypotheses.
If a green pass count is hiding missing run evidence before release, see how Ship links coverage, runs and issues: get started free, no credit card needed.

What should you do right now?
Open your Ship dashboard and check it against your release questions, not its charts. Reuse this checklist, based on the Ship dashboard guide, as a release review template:
- Confirm the workspace and environment match your intended test target.
- Wait until crawl, code or change analysis finishes before you read results.
- Open one failed run and confirm it has screenshots, video, trace, and console and network logs.
- Check rerun and self healing history to tell stable passes from recovered ones.
- Select
Report issuefrom the run, or link an existing ticket inIssues. - Fix any integration connection warning before you trust tracker sync.
Bottom line
A dashboard supports a release decision only after you open the evidence behind it. In Ship, check the environment, AQE Terminal, coverage, analysis status and linked issues. Then confirm the exact run has step results, screenshots, video, trace, logs, and rerun and self healing history. Without that evidence, a green count is just a summary.
Sources
The flaky test statistic comes from the primary source below, published by Google's engineering productivity team. Every description of how Ship reads coverage, runs, issues and evidence comes from the ContextQA learning documentation. Product capability pages, such as root cause analysis, impact analysis and the MCP server, are linked inline where they appear.