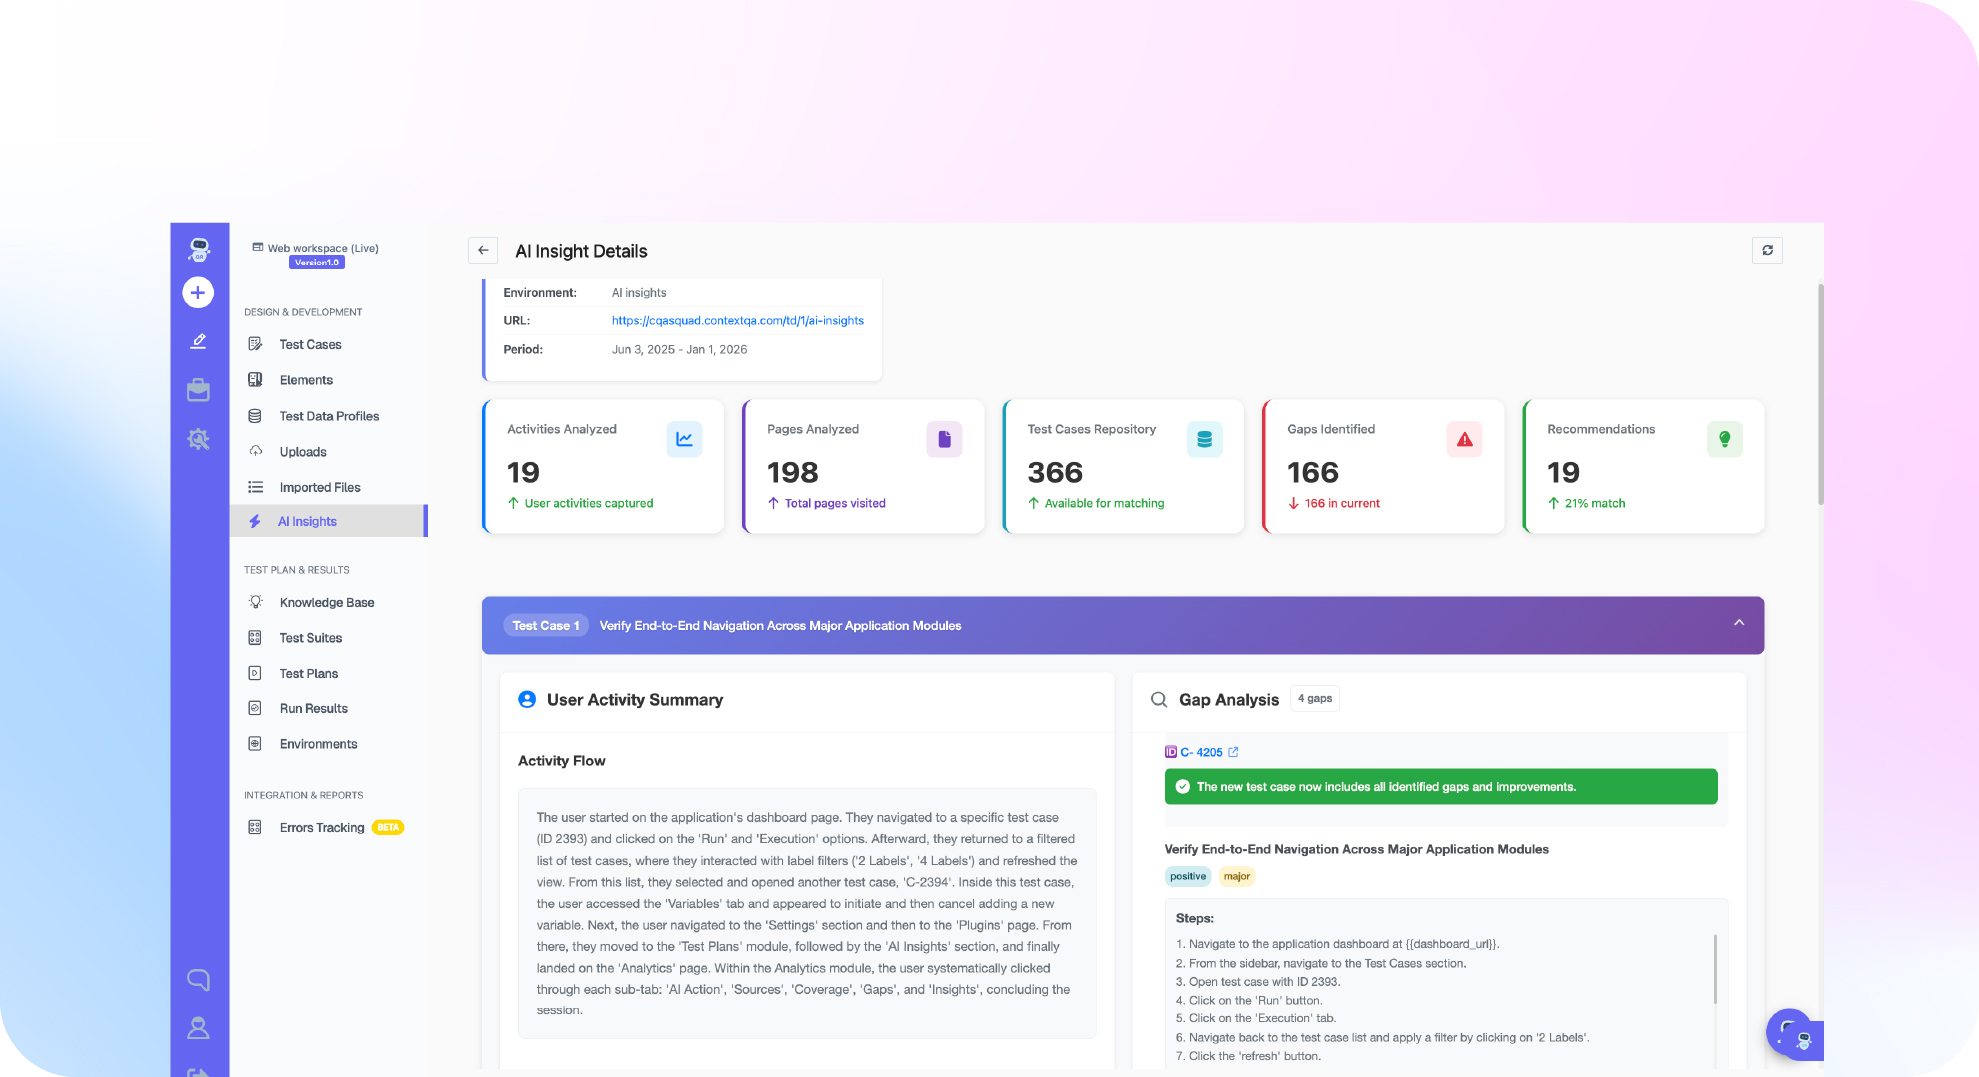

TL;DR: A useful test automation case study reports three things: the baseline, the change made, and the measured result. The metrics are regression cycle time, flaky test rate, escaped defects and maintenance hours for each release. The stakes are large: CISQ estimated that poor software quality cost US companies $2.41 trillion in 2022 (CISQ, 2022). One approach is to test every pull request before merge instead of waiting for a nightly suite to fail. Ship, the ContextQA autonomous quality engineer, does this with impact analysis and targeted regressions.
A test automation case study only helps if it measures what changed in your release pipeline, not how many scripts you wrote. This guide covers which metrics to track for each pull request, how to set a baseline, and how to read the numbers after automation.
Quick answers
What baseline data should a team collect before an automation pilot? Record regression cycle time per release, the split between manual and automated tests, flaky test rate, defect escape rate, and engineer hours spent on test maintenance each sprint. Pull these from Jenkins or GitHub Actions run logs and Jira defect data, not estimates. Without a dated baseline, nobody can check a before and after claim.
How long should a test automation pilot run before the results count? Run it across several full release cycles, including at least one release with significant UI changes. That way the results cover maintenance and not only first run creation. Report the pilot window, how many releases it covered, and which flows were in scope.
How can a QA lead tell whether a vendor case study is credible? Look for a named customer, a dated baseline, exact metric definitions, and a link to where the numbers came from. Distrust percentages that come with no suite size, pipeline context, or time period. The strongest check is to repeat one measured flow in your own CI pipeline during a trial.
What is a test automation case study?
A test automation case study is a written account of how one team automated part of its testing, what it changed in its pipeline, and what happened afterward, in numbers. A good one names the baseline, the tooling and process changes, and the before and after results, so QA leads and CTOs can judge fit before committing budget.
Case studies that show real return on investment (ROI) track the same four numbers before and after:
- Regression cycle time: hours from merge to a green suite.
- Maintenance load: engineer hours per sprint spent repairing broken selectors and rewriting tests.
- Flaky test rate: the share of failures that pass on rerun with no code change.
- Escaped defects: bugs found in production that a test should have caught.
If a percentage has no linked source, date, or named team, treat it as marketing. For smaller product teams, Ship tests every pull request, so you can measure these numbers against your own CI history.
What can a strong case study do?
A strong case study sets a dated baseline, explains how the result was achieved, names what broke along the way, and states what adoption cost. With those four elements, another QA lead can decide whether the same approach would work in their own release process.
- Sets a baseline. It gives the original numbers, such as regression wall clock time or reruns per merge, with a date and a named source.
- Explains the mechanism. The reusable lesson is the method, for example running only the tests a pull request affects instead of the whole suite.
- Names the failure modes. It lists stale selectors, order dependent tests, and flaky tests that pass or fail without a code change.
- Shows adoption cost. It says whether the team kept its existing CI config, such as
.github/workflows/test.yml, or had to rewrite its process.

Why do automation case studies matter in 2026?
Automation case studies matter more in 2026 because AI tools now generate more application code and test code, and teams need evidence of what that changes in a real pipeline. A credible study reports suite size, flake rate, maintenance hours, and merge time before and after. Vendor claims rarely do.
Two data points show the pressure. Google's testing team reported that about 16% of its tests showed some flakiness, and about 1.5% of all test runs returned a flaky result (Google Testing Blog, 2016). In the Stack Overflow Developer Survey, 2024, 76% of respondents said they were using or planning to use AI tools in development. When more code ships faster, unstable tests block more merges.
A useful study compares both approaches on the same flows:
- Traditional WebDriver style suites: engineers write selectors and waits by hand, so every UI change becomes a maintenance ticket.
- AI driven approach: tests are generated from a flow, ticket, or code change. The study should report hours spent fixing tests, false failure rate per run, and time from pull request to merge.
For small teams evaluating Ship, the question is narrower: did impact analysis and targeted regressions on each pull request catch defects before merge, and did reproducing bugs from Jira or Linear shorten triage?
How does a testing case study work?
A testing case study follows a team from a measured starting point to a measured result. It records the baseline (manual regression time, escaped defects, flaky test rate), the change made, how that change reached the release pipeline, and the outcome after a fixed period. Each number links back to its source.
For a move from manual testing to automated CI/CD, the steps usually run in this order:
- Capture the baseline. Pull manual regression time, escaped defects per release, and repeated manual flows from your own tracker.
- Narrow the first scope. Automate the flows that break most often, such as login or checkout.
- Move tests to the pull request. Ship runs impact analysis on every pull request and targeted regressions before merge.
- Close the bug loop. Ship reproduces bugs reported in Jira, Linear, or Slack and gives engineers the likely root cause with evidence.
- Measure again after a fixed window. Compare the same metrics over the same number of releases, and publish only what the data shows.
Which approach fits your team?
The right approach depends on team size and where bugs slip through. Small product teams that merge several pull requests a day fit Ship, because it tests every pull request before merge. Teams with dedicated SDETs may keep an in house framework. Whichever you pick, measure it with the same ROI formula.
- In house framework: full control, but your engineers own selector maintenance, flaky test triage, and CI wiring for as long as it exists.
- Legacy record and playback tools: quick to start, but recorded scripts break when the UI changes and must be recorded again.
- Ship (self serve): runs impact analysis and targeted regressions on each pull request and reproduces reported bugs with root cause evidence. You can start free with no credit card.
- Enterprise suites: teams testing Salesforce, SAP, or ERP workflows end to end should look at ContextQA enterprise apps testing and the platform solutions, which are sales led.
To measure ROI, take a baseline for one sprint and then track:
hours_saved = maintenance_hours_before - maintenance_hours_afterROI = ((hours_saved * loaded_hourly_rate) + escaped_defect_cost_avoided - tool_cost) / tool_cost- Escaped defects per release and mean time to reproduce a reported bug
The rule: choose the option that lowers maintenance hours and escaped defects in your baseline, not the one with the longest feature list.
How does ContextQA handle a test automation case study?
Ship, the ContextQA autonomous quality engineer, runs impact analysis and targeted regressions on every pull request before merge, reproduces reported bugs, and attaches the likely root cause.
A study built on Ship follows the same loop the product runs:
- Pull request opens. Impact analysis picks the flows the change affects, and Ship runs targeted regressions on them before merge.
- Bug gets reported. Ship picks up the report from Jira, Linear, Slack, or a service desk, reproduces it, and finds the likely root cause.
- Evidence goes to engineers. The developer gets the reproduction and the evidence instead of a vague ticket.
- Numbers come from your pipeline. Take baseline and after values from your own CI history: escaped defects, time to reproduce, and reruns per failing build.
Can your case study show which pull request broke what? Ship, the ContextQA autonomous quality engineer, tests every pull request and hands engineers root cause evidence. Get started free, no credit card needed.
What should you do now?
Treat any published automation result as a hypothesis and test it against your own pipeline. Pull a baseline of maintenance hours and flaky failures, pick one product flow, and run a time boxed pilot on real pull requests. Judge the result on numbers you measured yourself.
- Export recent CI history and count reruns, quarantined tests, and failures closed as "test issue."
- Add a
test-maintenancelabel to tickets for one sprint to get a baseline in hours. - Try Ship on a flow that breaks often, and let it test every pull request before merge.
- Compare the targeted regressions Ship selects with what your full suite would have run.
- Send one real bug from Jira, Linear, or Slack to Ship and check its reproduction against what your engineer found.
- Count
test-maintenancehours again with the same label and window, then write up the before and after numbers.
Bottom line
A credible automation result shows where the team started, what changed, and how each number was measured. Track maintenance effort, flaky test rate, CI feedback time, and escaped defects before and after rollout. If test automation in software is new to your team, set those baselines first. Then judge any tool, including an autonomous quality engineer, on whether it moves your own numbers.
Sources
Every statistic in this article comes from one of these primary sources. Check the method and context before reusing a figure in your own case study or business case.